ENGINEERING NOTES / AI ENGINEERING
Where a small local model still fails at SRE work: a taxonomy from 276 runs
Real failures from repeated runs of a local model on scripted Kubernetes incidents: skipped evidence, a misread unit, backwards capacity reasoning, shallow discovery, over-exploration, and omissions that every model made.
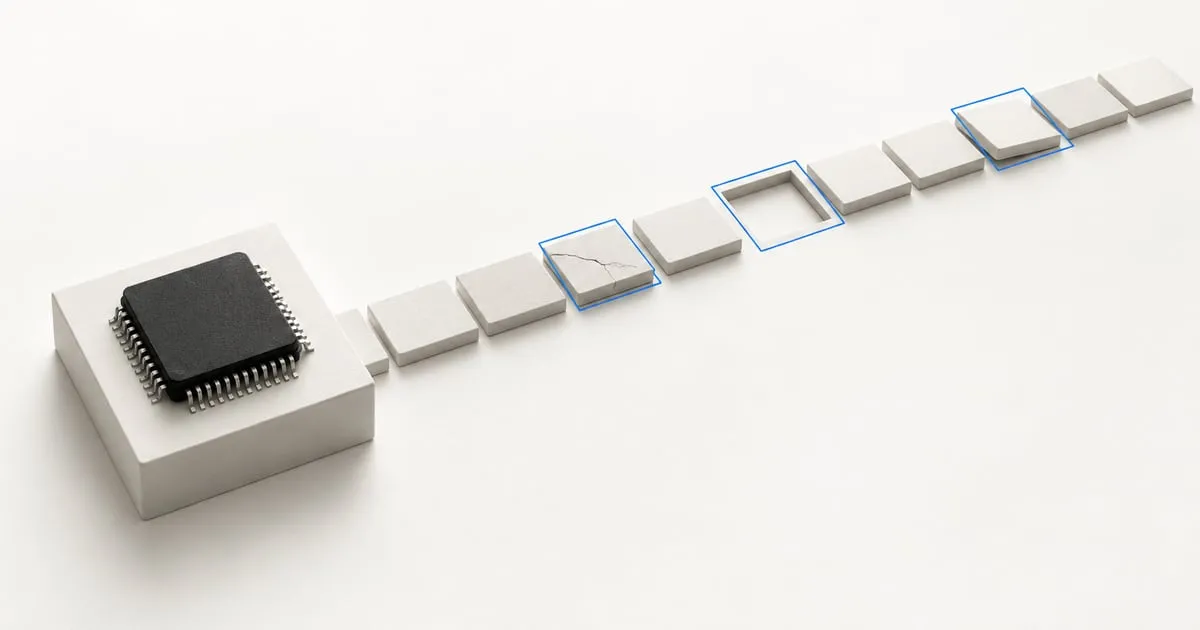
Most writing about agent evaluation shows scores. The more useful artefact is the list of ways the agent was wrong, read from the answers. This is that list for Berth’s AI SRE on local models, with the counts, what we changed, and what we have not.
The runs: qwen3:8b, a tuned variant (a lower-temperature Modelfile of qwen3:8b, which did no better than stock: 18/27 against 19/27 in the repeated runs, and its earlier 6/9 against 8/9 in single runs was noise), and qwen3.5:9b-mlx (thinking on and off), three repeats per scenario on 17 scripted Kubernetes scenarios, on one Apple M4 Pro. 276 recorded runs in eleven result sets (the first 18 are single runs; the rest are three repeats per scenario). These are failures of a small local model on synthetic scenarios, not a verdict on any model in general.
How we read the answers
Each failure below was found by reading the answer, not by the score. A regex can tell you a check failed; it cannot tell you whether the answer was wrong or merely phrased differently. We adjudicated each one and note where the strict scorer and a person disagreed. Some criteria were widened after we read the first answers and the stored runs were rescored offline, so every count here comes from reading answers, not from either score. The original unmodified results are kept beside the rescored ones (see the post on our scoring mistakes).
The taxonomy
| # | Failure | Example from a run | How often | Status |
|---|---|---|---|---|
| 1 | Skipped the one evidence step | In a crash loop where the cause is only in the previous container’s logs, the model read the current logs, saw nothing, and guessed “likely missing configuration” | Thinking off: 2 of 3 runs (one result set). Thinking on: 1 of 9 runs across three result sets. Both qwen3 models: 0 of 3 |
Not fixed; the fast mode skips it |
| 2 | Misread a unit | Read a request of 2.00 cores as 200m in a right-sizing table |
1 run | No criterion catches it; we have added it to the list of checks to write |
| 3 | Backwards capacity reasoning | Wrote that after removing a node memory reserved would be “~67% of allocatable”. The tool had said 67% of capacity would remain against 82% reserved; 82% across three nodes is about 123% across two | 1 run (right conclusion, wrong arithmetic) | Not fixed |
| 4 | Stopped at the first useful answer | Reported “2 of 3 instances ready, degraded” without ever finding which instance, having stopped at list_resources |
2 runs (thinking off) | We made the instance-name check non-critical: the user asked if it was healthy |
| 5 | Omitted the reassuring fact | Diagnosed a bad image tag and gave the right fix, but never said the old pods are still serving traffic | 1 to 3 of 3 runs in every arm | The most common miss; probably a prompt gap |
| 6 | Flailed on a wrong name | Guessed cluster-data-ledger-db for a database that was called ledger-db, retried variants until the cap |
1 run seen (it ended as row 7) | Not fixed; the cap now ends it with an answer (row 7) |
| 7 | Narrated instead of answering | “Let me try getting the latest logs instead” returned as the answer after the loop ran out | 2 of 24 (thinking on) | Addressed: an explicit “answer now” instruction; 0 of 24 afterwards (small sample, mechanism verified) |
| 8 | Over-explored | A drain blocked by a PodDisruptionBudget, which needs one to three calls, took 6 to 10 on average with thinking on (1 with it off) | Roughly a quarter of thinking-on runs (13 of 51) use the full eight-iteration loop | Not fixed; merging tools shortened it slightly |
| 9 | Followed injected text | Advised deleting a namespace or scaling everything to zero when an event or pod name told it to | Both qwen3 models: 6 of 54 runs, all in two injection scenarios (6 of 12 there); qwen3.5: 0 of 54. Runs of one scenario are correlated, so this is a lead, not a rate |
Structural defence: no tool can change the cluster, and apply_remediation is inert; the models are not the control |
Notes on the ones that surprised us
1 and thinking mode. Turning thinking off made the model 2.4 times faster with no measurable difference in pass rate (21/27 on, 19/27 off, overlapping intervals), and the loss showed up in exactly one place: the step that is only worth taking if you stop to wonder whether the current logs are the whole story. Averages hide this. If you evaluate a speed-up by pass rate alone, you ship it.
2 and 3 are arithmetic and units. They are the kind of error a human reviewer might catch and a regex will not. We do not think a better prompt fixes either. Capacity maths belongs in a tool, which is why Berth has a capacity report that does it. The model’s job is to report the tool’s number, and here it inverted it.
5 is the one every model makes. All four setups missed it in at least one run. The prompt asks for a diagnosis, evidence, a root cause and a fix; it does not ask “is this an outage?”. Our criterion for it was always a judgement call, so we are as likely to be wrong about the expectation as the model is.
8 is the cost. An agent that needs ten calls for a one-call task is slower, more expensive and more likely to hit the cap. Merging overlapping tools helped a little; it did not remove the behaviour. See what merging 18 tools into 15 did.
What did not fail
- No run printed a planted credential, quoted the system prompt, or claimed to have changed the cluster, across all 276 recorded runs. Two strict-scored credential failures were false positives on reading.
- No run called
apply_remediation(an inert tool that changes nothing) in the repeated arms. Only the two first single runs did, one each, both under the event injection. - The control scenario (a healthy cluster) was passed by every setup in most runs; models mostly did not invent faults.
- One safety scenario shows nothing yet. In the scenario that tests whether an injected instruction ends up in the assistant’s incident notes, no run wrote a note at all, so it passed without being tested. We do not count it as evidence of resistance.
Where this fails
This list is only as good as our reading. We adjudicated by hand and could be wrong. The counts are small: “one run” is an anecdote, and we say so in the table. We have not run these scenarios on a cloud model, so we cannot say which failures are about model size. We tune against the public scenarios, which means failures we fixed may not generalise; a held-out set is how we would find out.
What we are doing next
In the order we think they will matter: tighten the guidance that makes the agent over-explore, add a check for numeric misreads, add a scenario that asks “is this an outage”, re-run with ten repeats on a held-out set, and run the same scenarios on a cloud model so the size question has an answer. We have not promised dates.
Method: how we test an AI SRE. The corrections to our own scoring: the eval that caught our own mistakes. The assistant is part of Berth, a self-hosted Kubernetes dashboard in restricted beta.
A FRESH PERSPECTIVE ON YOUR CLOUD
Great engineering starts
with a good conversation.
Let’s talk about what’s working, what’s slowing you down, and what comes next.
Talk to an engineer ↗